Weekly Forex Chart Analysis – March 31st – April 4th 2014
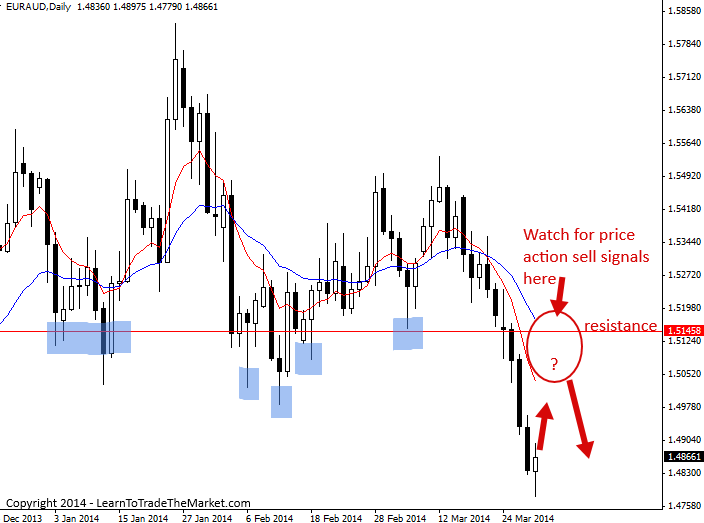
EURAUD – Euro/Aussie begins trending lower, looking for sell signal from resistance
The EURAUD is not a pair we discuss often, but it’s been interesting as of late. We can see a strong break lower has occurred over the last two weeks, kicking off a fresh downtrend. This week, if the market retraces back up to the 8 / 21 day EMA resistance layer or the key near-term resistance near 1.5150 area, we will watch closely for price action sell signals to rejoin the downtrend.
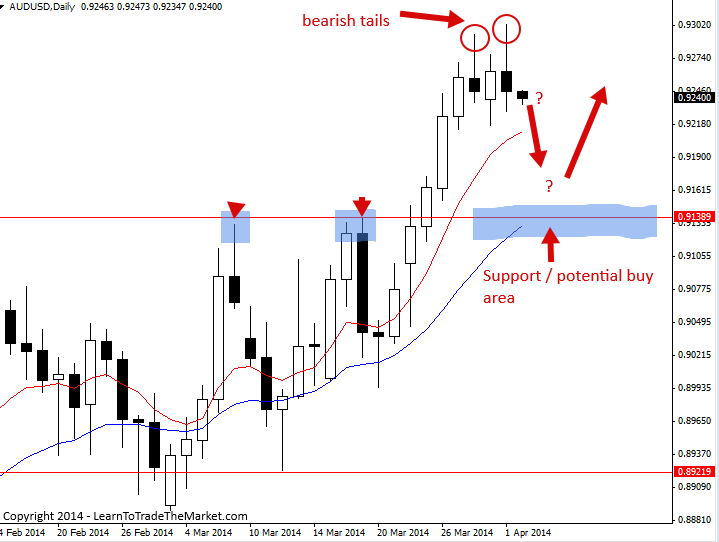
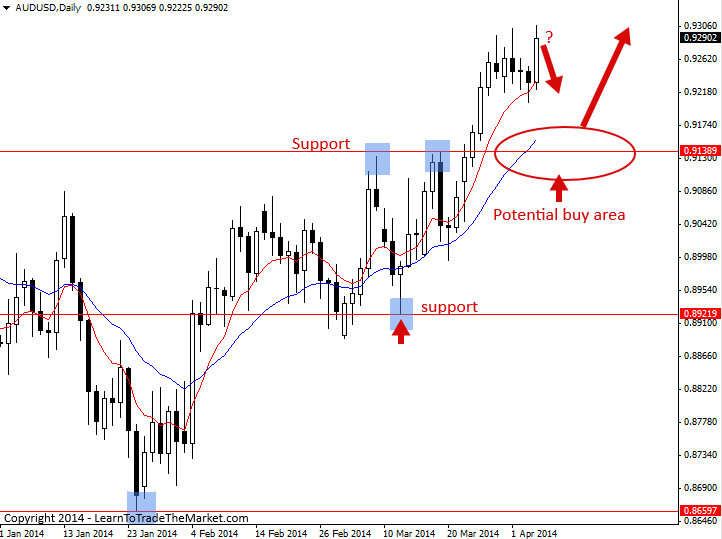
AUDUSD – stalls, watching for buy signal from support, 1st April 2014
The AUDUSD failed to gain ground today and showed rejection of higher prices for the second time in three sessions. The uptrend is still intact in this market, but we could see a retrace back to value / support before it continues, as we mentioned in this week’s weekly forex chart analysis. Traders can continue to watch the 4 hour and daily chart time frame for price action buy signals from support if the market rotates back to the 8 / 21 day EMA or other support levels.
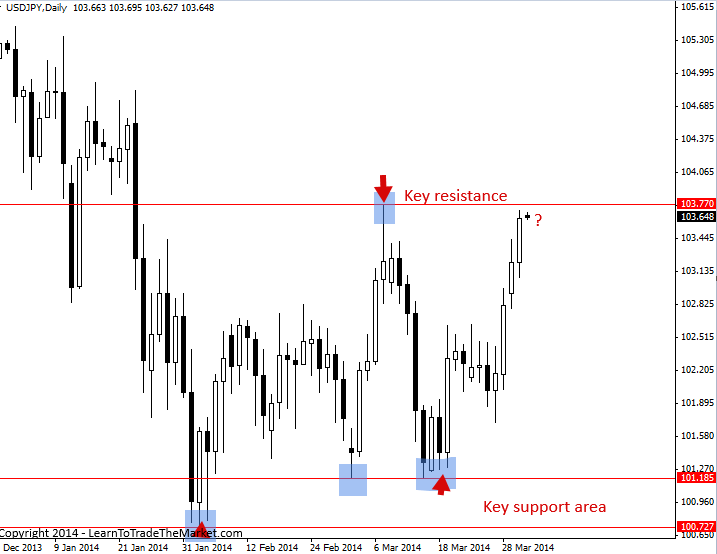
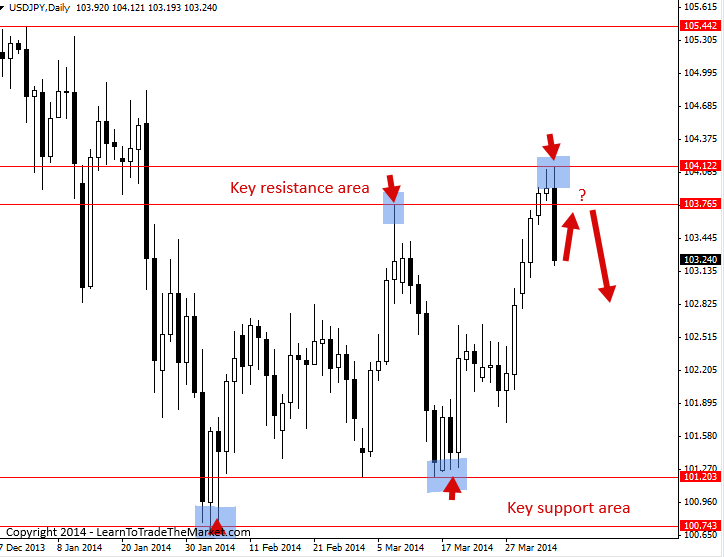
USDJPY – strength continues up toward key resistance, 1st April 2014
The USDJPY pushed higher again today, gaining significant ground and ending the day just below the key resistance and trading range top at 103.75. If the market forms a daily chart price action sell signal near that 103.75 key resistance level, we would consider a trade back down toward support of the trading range. However, if the market closes above 103.75 and remains buoyant near that resistance, it would imply a continuation of this recent upward move.
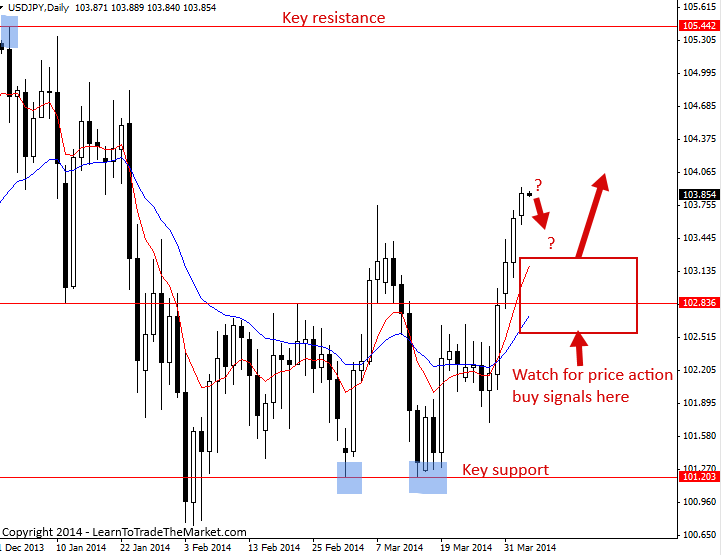
The USDJPY continued higher today, essentially ignoring the key resistance near 103.75 to end the day at 103.87 as the bullish momentum continued. The market has now broken out from the trading range it has been in since the beginning of February, closing above that 103.75 resistance today, which was the top of the range. Clearly, bulls are in control in this market and so we will watch any retraces back to value / support areas for price action buy signals to rejoin the uptrend.
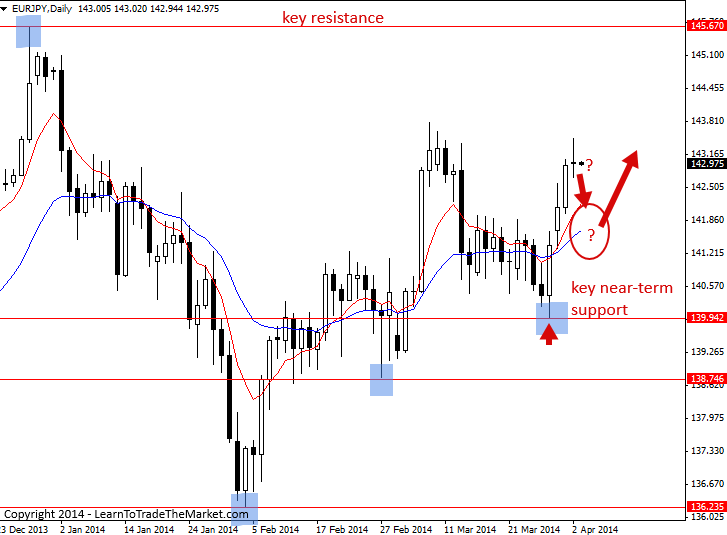
The EURJPY has also been gaining ground recently as the Japanese yen continues to weaken against all the other majors. We will also watch for price action buy signals on a rotation back to support in this market. Keep an eye on the 8 / 21 day EMA dynamic support layer as well as obvious horizontal support levels for buying opportunities.
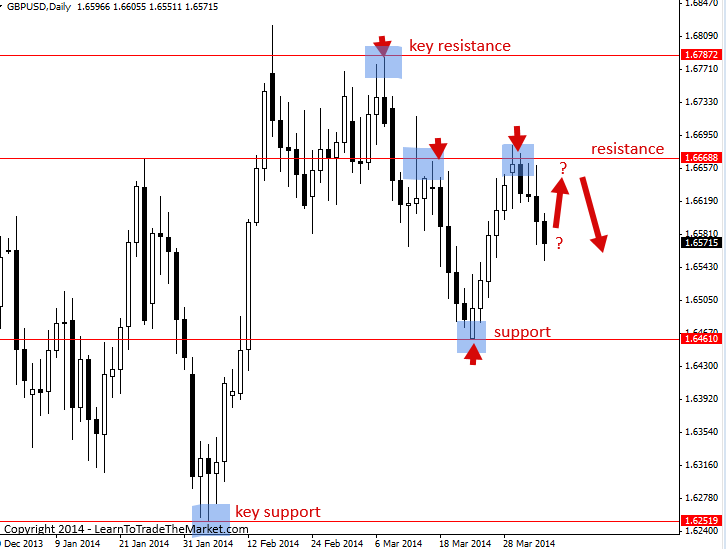
GBPUSD Resistance Holds, Looking for Sell Signal, 3rd April 2014
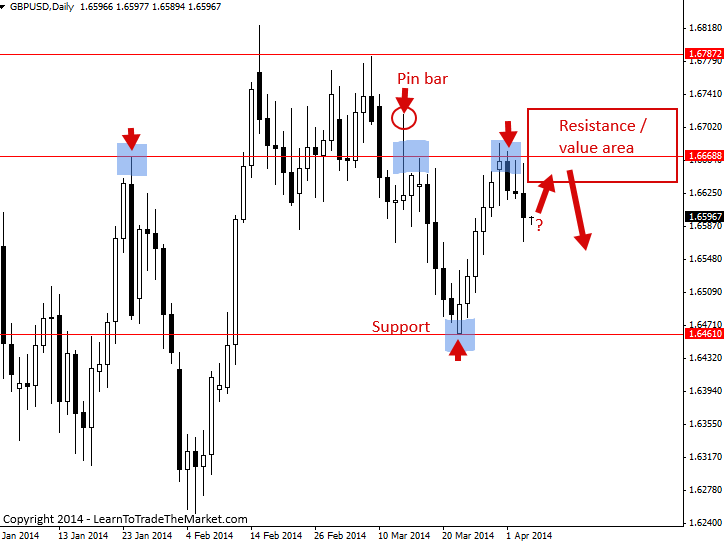
The GBPUSD has fallen lower over the last three days after hitting the resistance and ‘event area‘ up near 1.6660. We can see a large bearish pin bar formed near this resistance back on March 13th, setting off a significant down move into 1.6460. Going forward, if the market rotates back up to 1.6660 area, we will look to sell on strength by watching for a price action sell signal from that resistance with the potential for a move back down to re-test 1.6460 support area.
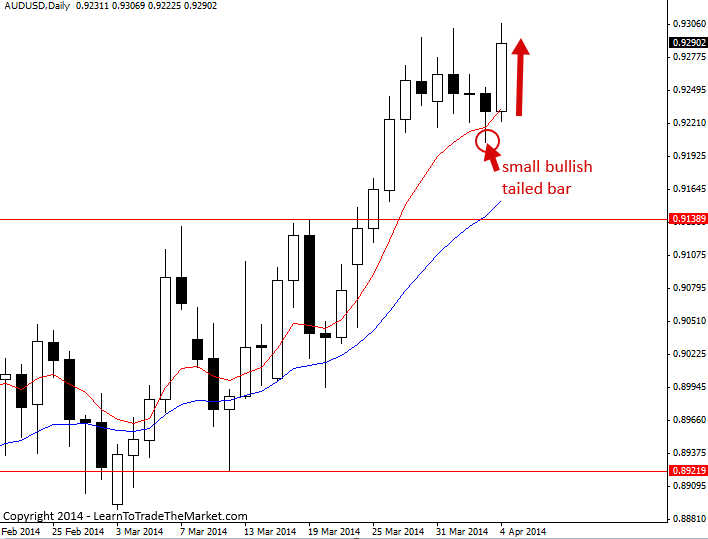
The AUDUSD gained significant ground today as price pushed up from the 8 day EMA support after yesterday’s test of lower prices. Note the small bullish tailed bar that formed yesterday at the 8 day EMA, showing rejection of it, this was not the best signal in the world, but it goes to show that bulls still clearly have control of this market. Ideally, we were looking for an obvious pin bar buy signal or fakey signal after a deeper retrace, however, sometimes we don’t get ideal / obvious signals when we want, this is part of trading. The good thing is, there’s always tomorrow and we can wait patiently for a nice price action buy signal from support next week. Traders can watch support at the 8 / 21 day EMA support layer as well as horizontal support levels for price action buying opportunities to trade in-line with the uptrend on a retrace back to value.
The USDJPY retraced significantly today, moving down to the 8 day EMA dynamic support level. Next week, we will continue watching for a price action buy signal from support, in-line with the recent bullish momentum. We are watching anywhere from current levels down to just below the 21 day EMA dynamic support for a price action buy signal.
Weekly Forex Market Price Action Outlook – April 7th – 11th 2014
EURUSD – Euro/dollar bears remain in control, but market is at support
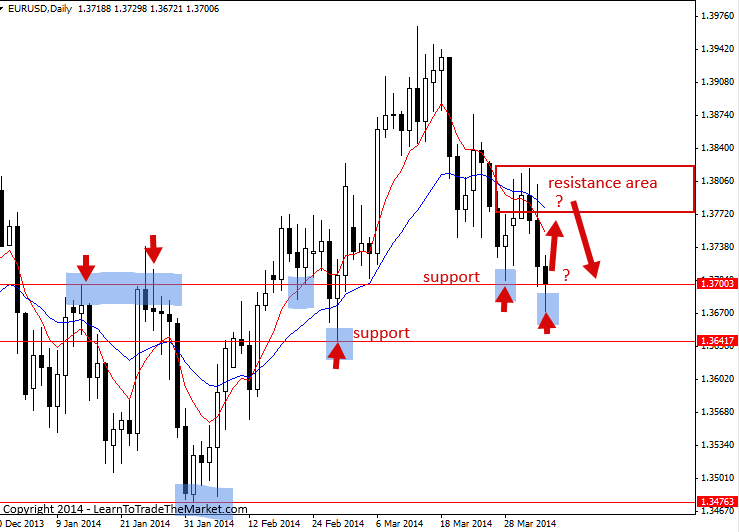
The EURUSD pushed up into the 8 / 21 day EMA resistance layer early last week but subsequently sold off as the bearish momentum continued as we discussed as a possibility in last week’s weekly forex price action outlook. On Friday, the EURUSD lost ground but did pare a lot of its losses late in the day to end right at the 1.3700 support level we’ve been talking about recently. However, the market clearly has been losing ground recently, and we could see this trend continue this week if resistance continues to hold as the market retraces higher. There is a lot of support coming in just below, still at 1.3700 and then down near 1.3640 area, so we could see chop / consolidation prevail at least early this week, but overall we are slightly more bearish biased on this market right now and would consider a sell entry from resistance if a nice daily chart price action sell signal forms this week after a retrace up into resistance.
Weekly Forex Market Price Action Outlook – April 7th – 11th 2014 GBPUSD – Sterling/dollar weakness continues, watching for sell signal from resistance
The GBPUSD has fallen lower over the last four trading days after hitting the resistance area up near 1.6660 which we discussed in our April 3rd commentary. As we discussed in that commentary, we can see a large bearish pin bar formed near this 1.6660 resistance area back on March 13th, setting off a significant down move into 1.6460, where the market found support. Going forward, if the market rotates back up to 1.6660 area, we will look to sell on strength by watching for a price action sell signal from resistance with the potential for a move back down to re-test 1.6460 support area.
Weekly Forex Market Price Action Outlook – April 7th – 11th 2014
AUDUSD – Aussie/dollar bullish run continues pushing higher, looking for buy signal
The AUDUSD gained significant ground on Friday as price continued to hold above the 8 day EMA support after Thursday’s test. Note the small bullish tailed bar that formed Thursday at the 8 day EMA, showing rejection of it. This was not the best signal in the world, but it goes to show that bulls still clearly have control of this market. Ideally, we are looking for an obvious pin bar buy signal or fakey signal to get long after a deeper retrace to support down near the 21 day EMA / 0.9150 area.
Weekly Forex Market Price Action Outlook – April 7th – 11th 2014
USDJPY – Dollar/yen trading range still in play
In light of the strong sell-off on Friday and weekly close back under 103.75 resistance, we are updating and amending our previous USDJPY outlook for this week. The market is still technically confined within a trading range if you look at the weekly chart and the bearish pin bar that formed last week. Given these facts, we would consider a sell entry from that key resistance area up near 103.75 – 104.12 if the market retraces higher early this week and forms a nice 4 hour or daily chart sell signal. If that happens, we could see a larger down move develop of perhaps a couple hundred or few hundred pips, which would put us back at that key support area of the trading range where we could once again watch for price action buy opportunities from support.
Weekly Forex Market Price Action Outlook – April 7th – 11th 2014
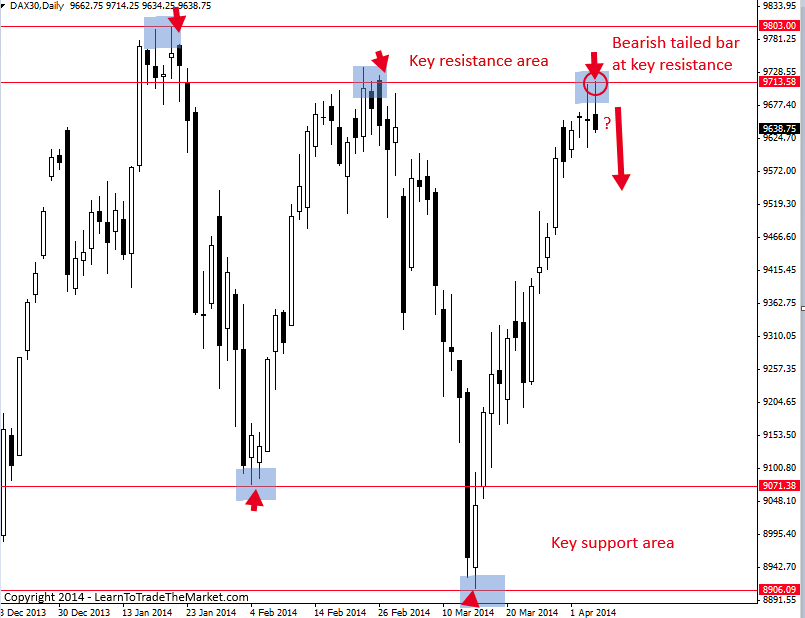
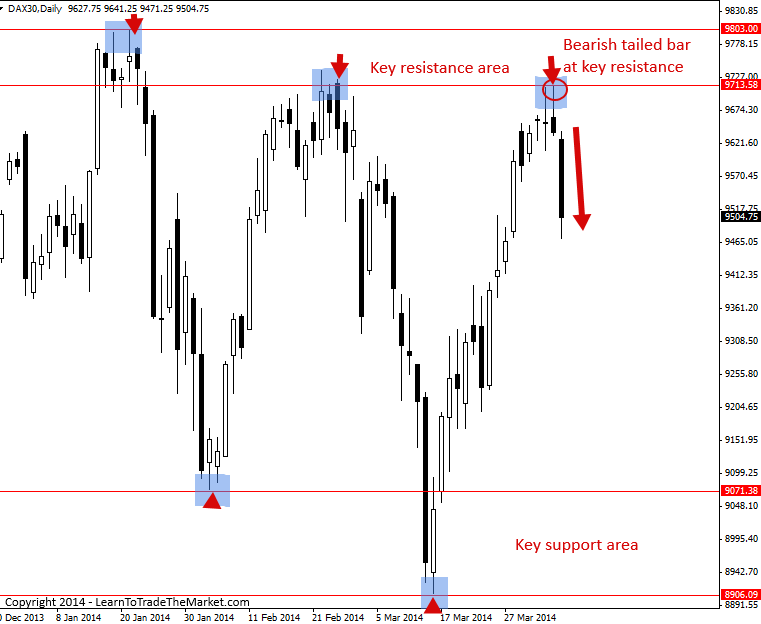
DAX30 – German Stock Index shows signs of failure at resistance
The DAX30 German Stock Index has rallied up to key resistance and late last week we can see it’s showing signs of stalling there and a potential reversal in the coming days. Note Friday’s bearish tailed bar showing reversal and rejection near 9715.00 key resistance, this also comes as the USA stock indices are under fresh sell pressure following false-breaking to new highs last week. If the market stays contained under this key resistance area, we could see a large sell-off in the coming days, potentially back down to key support near 9075.00 – 8909.00 area.
DAX – German Stock Index falls away from key resistance, 7th April 2014
As we discussed in our weekly price action outlook for this week, the DAX (German Stock Index) was showing signs of failure up near 9801.00 – 9710.00 key resistance late last week with a bearish tailed bar forming there on Friday. Today, we can see the market has fallen significantly lower following Friday’s rejection / reversal bar, and with no key support seen for quite a while, we could see this down move continue in the coming days. As we can see in the chart below, the DAX is in large-swinging trading range with key support not seen until down near 9075.00 area. In the near-term we can continue watching for more price action sell signals whilst the market is contained below key resistance between 9801.00 – 9710.00 area.
DJ30 – Dow Jones index weakens after false-break at new highs, 7th April 2014
The Dow Jones futures market fell lower again today following the false break to new all-time highs that we mentioned in this week’s weekly price action outlook. We could see the market move lower and retest the next support near 15,977 in the coming days if this bearish momentum persists. Traders can watch for more selling opportunities in the near-term whilst the market is contained below 16,572 key resistance.